National Evidence-Based Oncology Navigation Metrics: Multisite Exploratory Study to Demonstrate Value and Sustainability of Navigation Programs


Key Highlights

First-of-its-kind study to examine outcomes, evaluate analytics, identify barriers/challenges, analyze performance improvement processes, and identify opportunities for future research.
Sites collected qualitative and quantitative data on 10 AONN+ evidence-based navigation metrics. Validated evidence-based tools were incorporated into the study design for data collection to help ensure like data elements were captured across study sites.
Domain Metric
Care Coordination/Care Transition Barriers to care; measuring the number and list of specific barriers to care identified by navigator per month
Care Coordination/Care Transition Diagnosis to initial treatment; measuring the number of business days from diagnosis (date pathology results obtained) to initial treatment modality (date of 1st treatment)
Operations Management/Organizational Development/Health Economics Navigation caseload; measuring the number of new cases, open cases, and closed cases navigated per month
Operations Management/Organizational Development/Health Economics Measuring the number of navigated patients readmitted to the hospital at 30, 60, and 90 days
Psychosocial Support Services/Assessment Psychosocial distress screening; measuring the number of navigated patients per month who received psychosocial distress screening at a pivotal medical visit using the National Comprehensive Cancer Network distress screening tool
Psychosocial Support Services/Assessment Social support referrals; measuring number of navigated patients referred to support network per month
Survivorship/End of Life Palliative care referral; measuring number of navigated patients per month referred for palliative care
Patient Advocacy/Patient Empowerment Identify learning style preference; measuring the number of navigated patients per month whose preferred learning style was discussed during the intake process. The group agreed this should be included, if we can identify a validated tool
Professional Roles and Responsibilities Navigation knowledge at time of orientation; measuring percentage of new hires who have completed institutionally developed navigator core competencies
Research/Quality/Performance Improvement Patient experience/patient satisfaction with care; measuring patient experience or patient satisfaction survey results per month. The group determined use of CCHAPS (Community-wide Children’s Health Assessment & Planning Survey) for measuring patient satisfaction
Study demographics include 2 academic, 2 community, 2 Oncology Care Models, and 2 maturing programs each with with more than 750 analytic cancer cases per year.


Quantitative Outcomes

Onboarding

  • Comprehensive data-mapping process completed with each facility
    • 60-minute WebEx conducted with each site to review data request and provide overview before site visit
    • 1 day on site with decision support, navigators, and data analysts to discuss existing processes, identify sources of data elements, and assign responsibility for pulling data
    • For any data not being collected, reviewed options to meet study requirements (develop template, update electronic medical record form, or enter data in study web portal)
    • Conducted follow-up Q&A sessions to discuss any data issues; also provided e-mail and technical support as needed

Barriers to Care

  • More than 10,000 barriers were tracked over the study period, with an average of 2.2 per patient
  • 90% concentrated in Physical, Practical, and Emotional categories

Diagnosis to Treatment

  • Average of 43 days to treatment for navigated patients; 11 days less than non-navigated patients
  • Patients with practical barriers (transportation, work, treatment decisions) had the longest diagnosis to treatment at 56 days

Caseload

  • 4,462 cases were tracked during the study, which equated to 88 per navigator
  • Our estimate for annualized caseload is 150-17
  • ~50% of caseloads were breast, lung, and prostate cancers

Readmissions

  • 30-day rate was 9.8%, 60 days was 14.3%, and 90 days was 16.3% during the study
  • Study period readmission rates were lower for 30, 60, and 90 days, possibly due to a higher ratio of stage I patients during the study period

Distress Screening (using NCCN Distress Screening Tool)

  • 42% of patients received a distress screen during the study (1,987 screens)
  • 35% of screens had a score of 4 or higher, indicating additional action needed

Social Support Referrals

  • 0.4 referrals per patient, with 54% completed internally
  • Breast and gastrointestinal had the highest ratio, at 0.7 referrals per patient

Palliative Referrals (using Edmonton Symptoms Assessment System [ESAS])

  • 15% of patients had palliative referrals
  • Observed that there was variability in the ESAS tool implementation between study sites, with a reported range of 0%-68%
  • Difficult to track since navigators did not directly create the order

Learning Styles

  • 2,013 patients had learning styles assessed; patients reported between 1 and 6 learning styles, with most reporting visual as their preferred method
  • 76% of styles were concentrated in visual and verbal categories

Patient Satisfaction

  • 6% of patients were surveyed (209 surveys)
  • All 8 questions were above 70% positive, with 5 above 80%
  • Navigators received the best feedback for encouraging participation in treatment decisions, asking for treatment goals, listening to needs, and talking about emotional concerns

Performance Improvement

  • Navigators play an instrumental role in identification of gaps in care and facilitation of performance improvement methodologies to drive practice change and quality
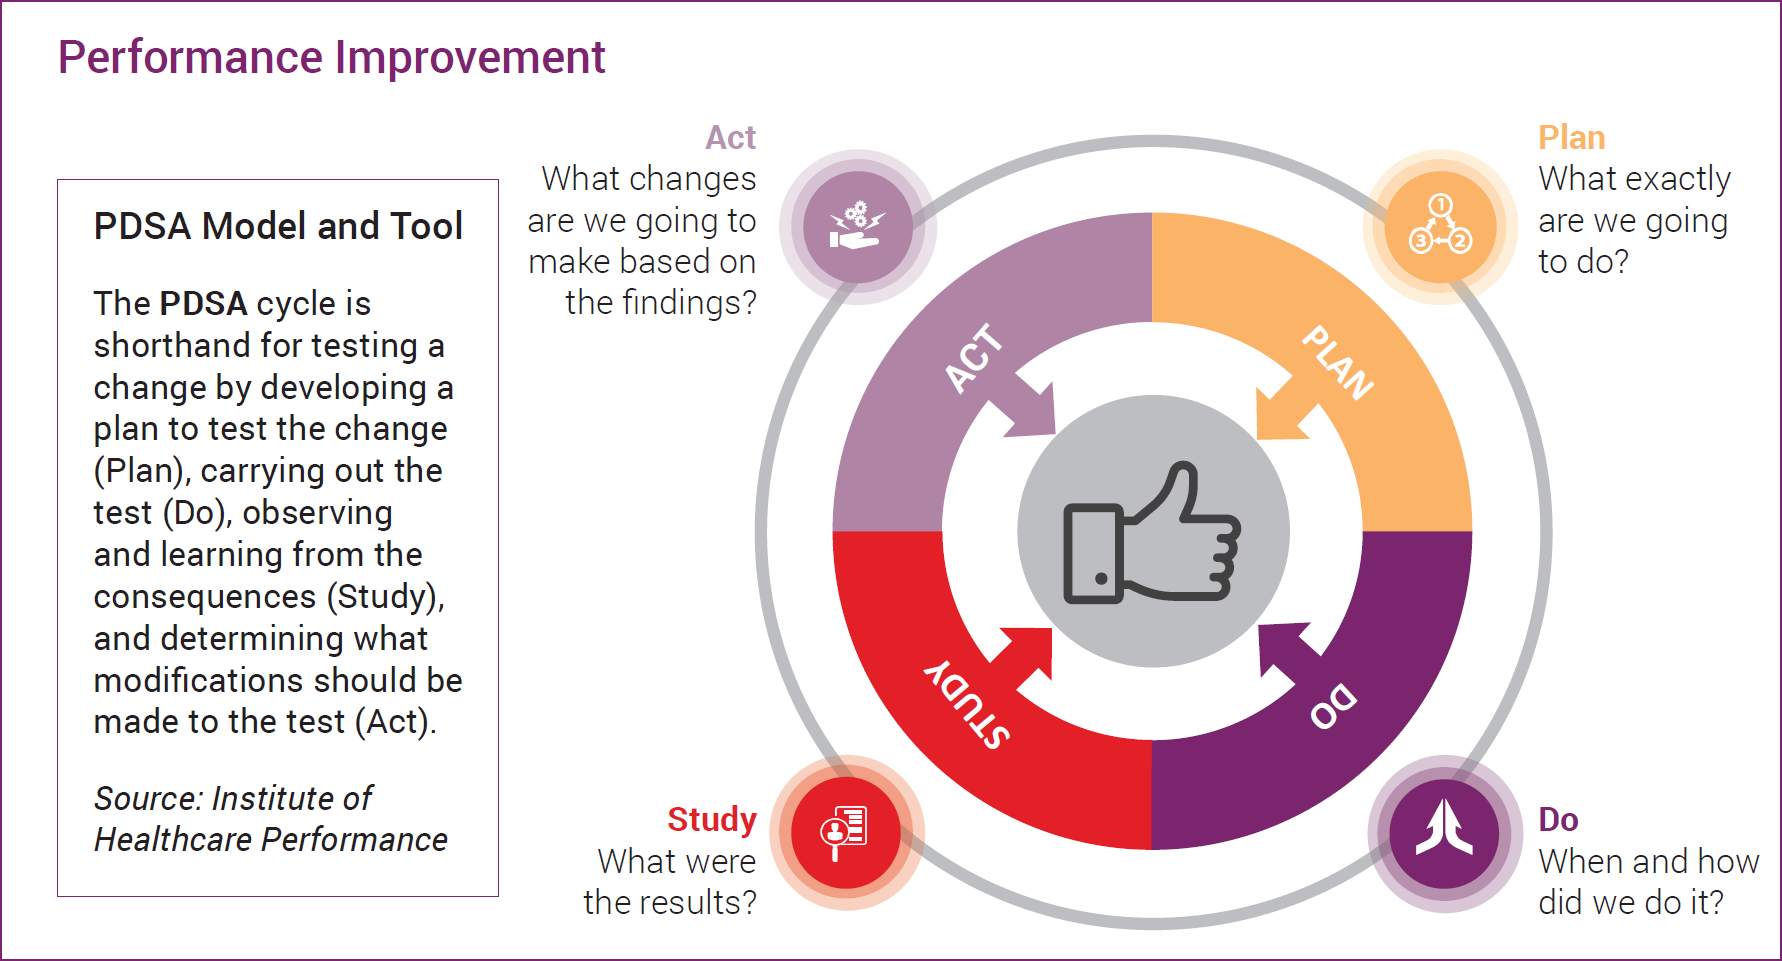
  • Performance improvement studies were completed utilizing the PDSA model and template
  • During the study period, sites conducted performance improvement activities in Distress Screening (4 sites), Palliative Care (4 sites), Patient Experience Survey (2 sites), and Caseloads (2 sites)

Case Example

Performance Improvements: Palliative Care
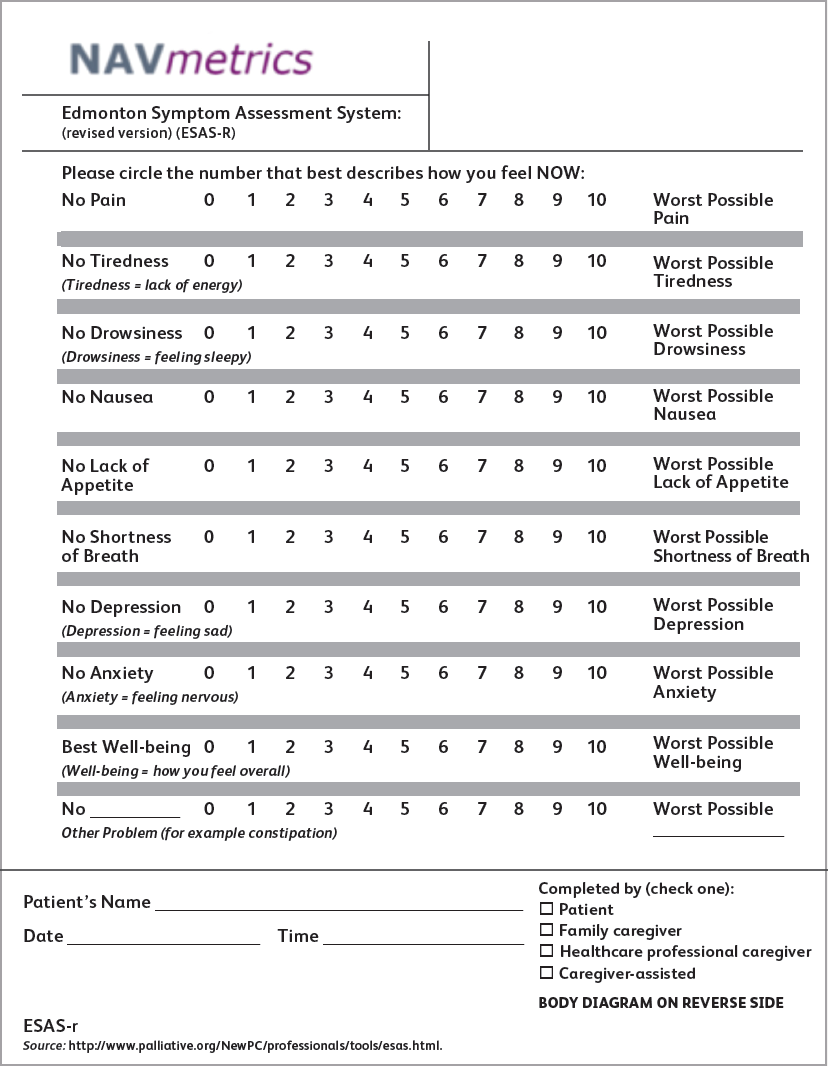
Measure Description

Number of navigated patients per month referred for palliative care services (for symptom management) utilizing a validated tool (ESAS, Edmonton Symptom Assessment System)

Opportunities

  • Develop a formal process to assess patients
  • Start with patients with advanced disease
  • Determine best time frame for assessing patients
  • “We never assessed our patients before palliative care needs”

Outcomes:

  • Increase referrals to palliative care
  • Our team found value in system assessments of our patients
  • Proactive assessments for palliative care
  • Nurse navigator completed with the patient and shared results “real time” with the physician

Qualitative Outcomes:

  • Navigators commonly felt overwhelmed by the prospect of tracking metrics; however, having a single location to capture these metrics helped to make the task manageable
    • This was effective even in sites with varied technological capacity, and proved helpful whether sites used customized electronic health record templates, Excel databases, or paper data collection forms
  • Navigators are more motivated to collect data on metrics that they believe demonstrate the value of their particular navigation program
    • Since the scope of navigation and the roles filled by navigators vary across facilities and health systems, the metrics that are perceived as most valuable also vary
    • Metrics unanimously perceived as useful in the metrics study included barriers to care, psychosocial distress, and social support referrals
  • Navigators expressed more satisfaction about collecting metrics that align with their usual navigation processes and activities
  • Navigators experienced more challenges to capture metrics that involved the introduction of new tools, activities, and workflows
  • Support from administration and other departments, including IT, is often necessary to capture metrics that may be collected elsewhere in the system
    • Unified electronic health record systems and the presence of discrete reporting fields are particularly helpful

Discussion/Summary:

  • Navigators demonstrated early adoption to metrics that directly aligned with their roles and responsibilities
  • Based on study participant perceptions and comprehensiveness of data collected, we have identified the following, which we recommend as core navigation metrics that navigators may directly influence and may apply to any program:
    • Navigator competencies
    • Navigator caseload
    • Barriers to care
    • Psychosocial distress screening
    • Interventions (including, but not limited to, social support referrals)
  • Navigation process metrics require additional resources and collaboration with the multidisciplinary team members
  • Early intervention of the navigator has a positive effect on barrier assessment, diagnosis to treatment, and social support referrals
  • Challenges with implementing metrics are highly likely, and buy-in from stakeholders is critical to help overcome challenges

Ownership of Copyright: Data of March 2020
Materials published in the Journal of Oncology Navigation & Survivorship (JONS) and by the National Metrics Study Investigational Team are owned and copyrighted by Green Hill Healthcare (GHHC). Materials under GHHC copyright remain the property of GHHC and may not be reproduced without permission from the publisher.

Continued research around navigation metrics is vitally important to ensure sustainability of navigation programs.